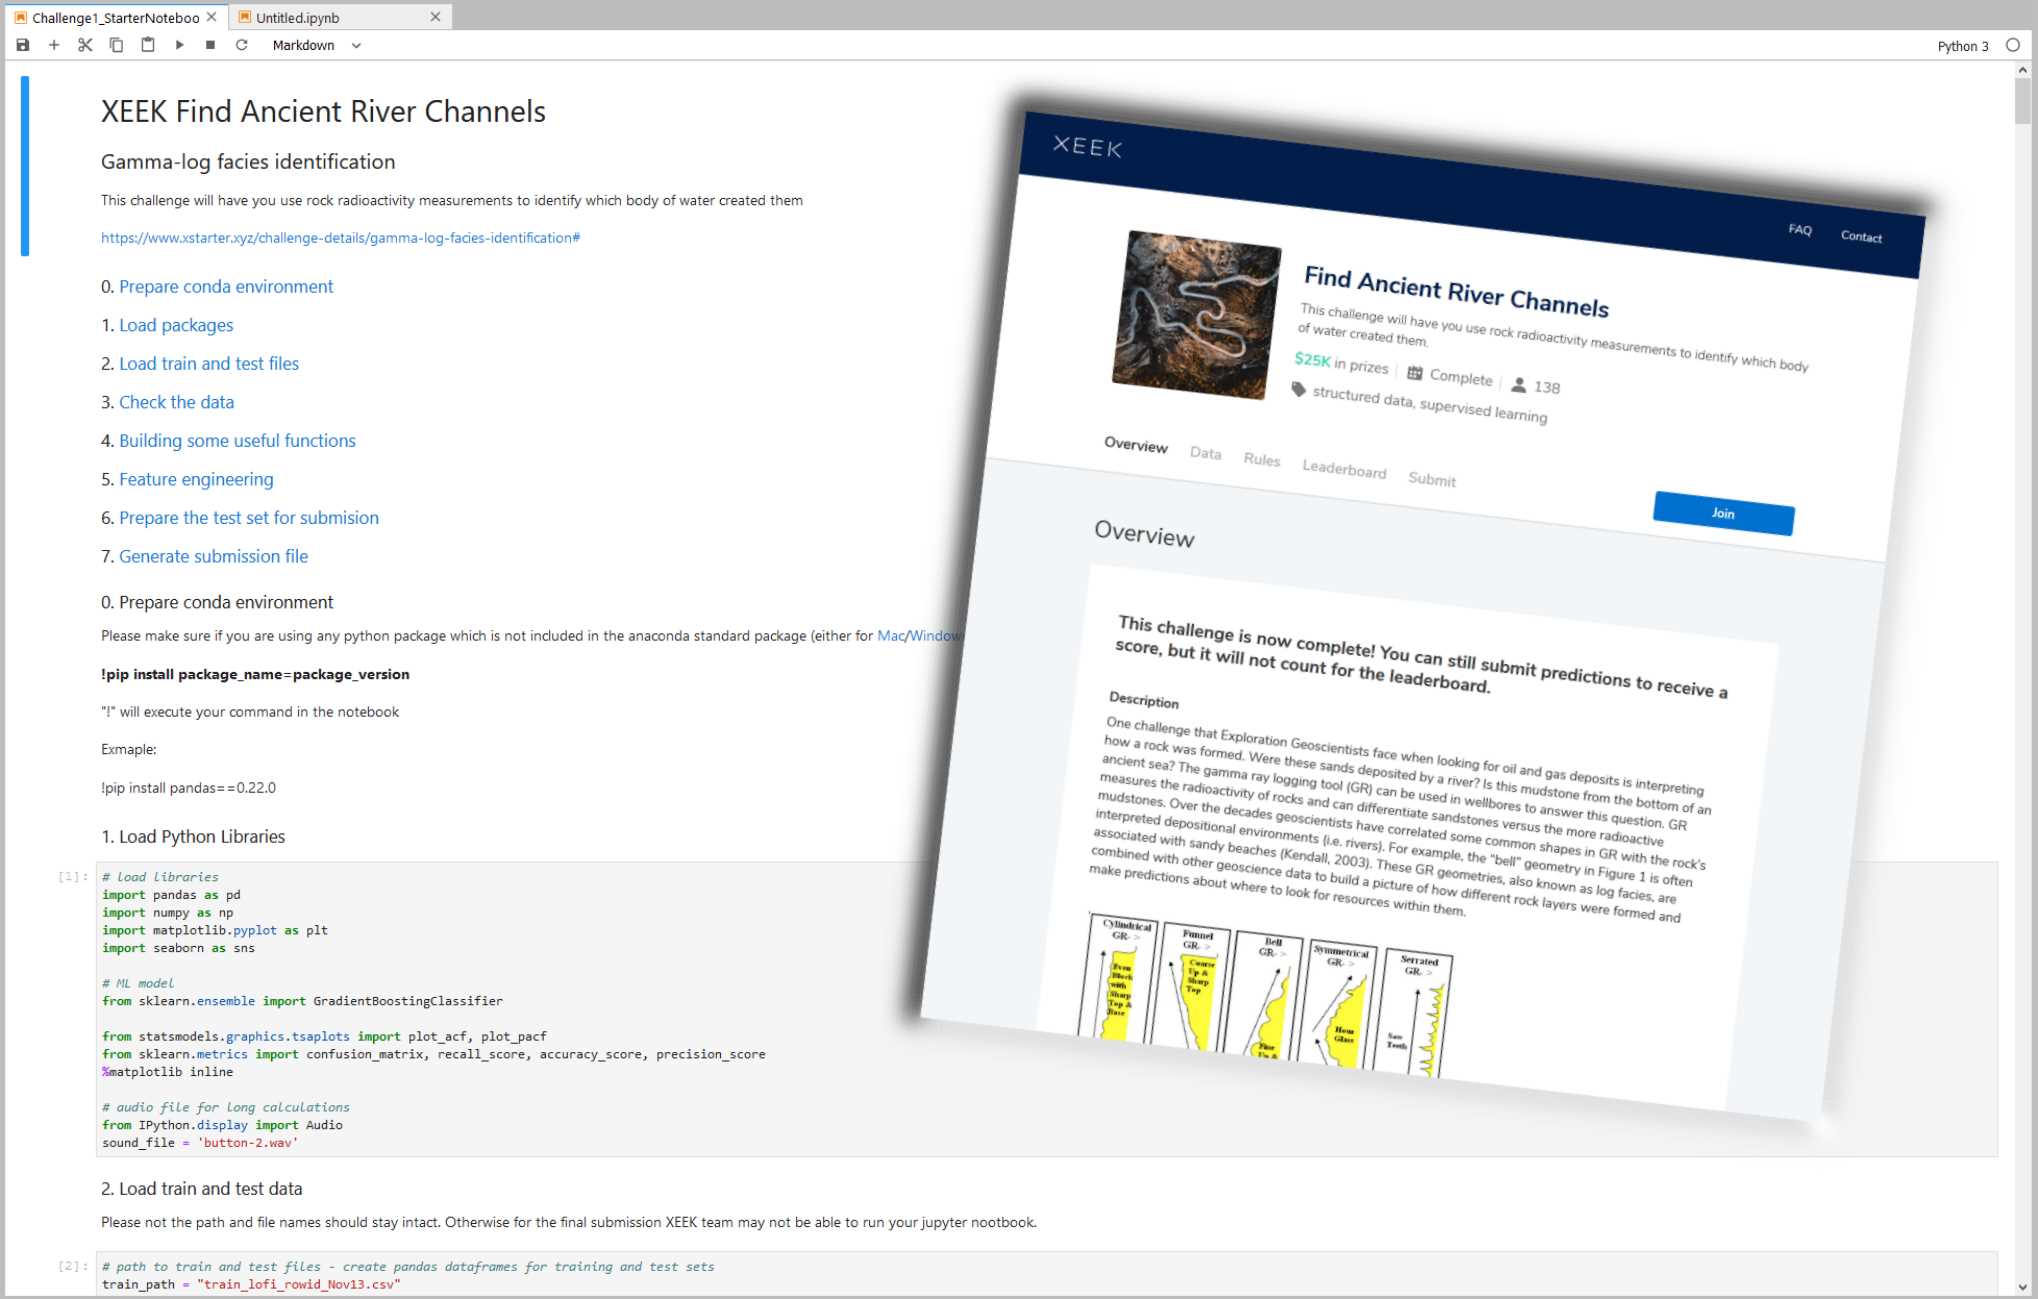
Getting started with the XEEK Machine Learning contest

Data Scientists and ML Researchers compete for the best geo-statistics algorithms on new competition platform.
Introduction
The Shell International Exploration and Production Inc. recently (November 2019) started a new webiste named XEEK (https://xeek.ai/challenges) with contests to predict facies from wireline logs via machine learning amongst many others. In many ways it is similar to Kaggle, but solution ways are not made public.
Third-party, business-hosted, competitions for Machine Learning (ML) solutions have been around for a while on https://www.kaggle.com/, but geology-related problems used to be relatively rare. This is changing now with XEEK.
Kaggle is known as not only hosting ML challenges, but also practice material. Experience Data Scientists share their solutions to competitions in notebooks called “kernels”. ConocoPhillips, Equinor (formerly Statoil), and many big tech companies have hosted challenges on Kaggle with large prizes.
Why should you consider this except for the prize money? Well, Data Science and Machine Learning is a relatively new field with limited formal degrees available from universities. Few people have experience and most wearing that hat are cross-trained. That makes it much more important to show what you really can do and present a portfolio of problems you have worked with.
If you are having trouple getting started, in addition to the problem description on the contest site, there is a file already available that explains how we can use machine learning to label Gamma Ray geometries from gamma ray logging tool (GR). The tutorial notebooks set you up to give you hands-on material to try it for yourself and at the end define the process to get the desired output file that you will submit. The main job for the participant is to try out their own approach and iteratively hone it for the duration of the contest.
As I have not worked with a lot of demographic or IoT data, but not necessarily had access to large data sets of proprietary borehole data, I would like to take you on a journey how I dug my way into the topic.
The Basic Tools
Jupyter Notebooks
Taking workshops, courses and reading up on anything Data Scinece e.g., on https://towardsdatascience.com/ amongst many others will inevitably expose you to a Jupyter Notebook. It revolutionized the Python experience and makes sharing and developing code so much easier by viewing the results of an operation in a separate window or just next to the code. In fact, the concept is not unique to Python anymore as Jupyter also runs Ruby, Julia, Spark, R, and many more. Matlab has a similar feature with their “Live Script”, and of course R is now best used in R Studio. You may think this could take a long time to assemble such an environmernt with a lot of optional open source addons to tweak the experience - a huge hassle for a newcomer. Turns out, it is not. An easy way is installing the Anaconda suite, which comes with Jupyter built in. Start Jupyter Labs with one click and done. The coding work is done in a Jupyter notebook, with the file extension “.ipynb”, where you can select your pogramming language kernel. Another amenity is the documentation’s superior formatting in Markdown language and having code snippets called “cells” by which only selected parts of the notebook can be executed and debugged at a time (instead of running the entire notebook over and over and wasting your time).
Once you get into the notebooks and start tweaking your code, you will realize that a notebook is not just an expanded documentation, but it is a truly interactive programming environment. Need to take a quick look at your dataframe? One line of code and hit Shift and Enter and it will appear right under your cell. No extra popup windows required. The beauty of creating code cells is that you do not need to re-run the entire notebook if you make a small change and wan to see the outcome.
To be clear, Jupyter Notebooks are not only necessary and useful for XEEK or Kaggle work, but are also the every day environment for Data Scientists. Jupyter notebooks are used for prototyping of ML models. However, for deployment, the code is typically written in a .py file or translated into Java Script with less eye-candy.
“Git” ready with GitHub
GitHub is a social integration of the git-versioning software. Think of it as the Facebook of programmers where a lot of open source projects are hosted with for collaborative coding and distribution. The central hosting and versioning aspect of it helps groups of programmers to share their code contributions in project repositories (“repos”) and manage and merge updates without having to keep track who now got the latest version of the files on their hard drive.
Visitors can “fork” the repository (i.e., taking a copy) and modify the contents after their own liking.

Source: https://myoctocat.com/
The Contest
Before getting started, I recommend reading through the rules and regulations on the contest. Find out what you can do with the data and how your solution will be treated, what rights the competitor has, and what is legally required of the participant to succeed. Read the Rules! .
Next step is downloading the competition’s starter notebook and the accompanying .csv files, which contain the actual data.
In the starter notebook XEEK used a “Gradient Boosting” algorithm utilizing multiple decision trees. Gradient Boosting is a specific machine learning algorithm that in each stage of regression fits trees on the negative gradient of the binomial or multinomial deviance loss function. This is an interesting choice, since it is a complex algorithm harder to understand, for example than the Support Vector Machine with its hyperspace used to separate different classes. The Gradient Boosting example with all default values yielded a precision of 0.788772 on the Validation Set, which you now got to beat. Your actual score will be published on the website when you make predictions on the Test Set. But you do not have the ground truth answers for the Test Set to score your own model yourself. The XEEK administrators will compare your Test Set predictions against the secret ground truth and publish your result on the contest’s scoreboard website.
The data set available for the contest includes thousands of wells all containing exactly 1,100 measurements each (no indications of sampling resolution) does not sound like something you would necessarily get in the real world and seems somewhat synthetic.
The starter notebook contains already some exploration including a procedure for smoothing, and splitting off a chunk of the original Train Set as Validation Set.
The whole proceedure to step through will look like this:
Train a model on Train Set (100,000 samples)
Predict on Validation Set (100,000 samples, score optimized for generalization)
Predict on on Test Set, save to .csv, send to XEEK (385,000 samples, scored by XEEK)

Machine Learning
The task at hand is a classification problem where the algorithm is learning to associate measured gamma ray values (the input X) to their assigned geometriy classes (the Y output), which tell the expert the facies and hence hydrocarbon reservoir potential. Here, the challenge is matching a pre-defined class label to gamma ray data. Since there are already labels for the gamma ray data available, we can use supervised learning algorithms. That means the selected algorithm will look for similarities in the labels and during inference use the model to match unlabeled data.
If you are not yet that comfortable with Machine Learning algorithms, I can recommend this course, which can be audited for free and delivers deeper insights into the mathematical background than many other courses on the market. After getting more insight in the basics of the algorithms, you may want to get deeper into popular Python libraries such as Sci-Kit Learn, XGBoost, or Keras. All of them come with great documentation and examples. No need to re-invent the wheel.

You’re back from the books? Splendid! Now you should have a better grasp on the concept of “training a model”, “generalization”, and “overfitting”. Those are the most important concepts you need for starters on the ML journey.
A big question is which algorithm will perform best with what kind of data and how to tune its hyperparameters. All these choices, knobs, and buttons seem a little bit like black magic and requires a lot of experience. However, it is something that can be learned and exercised with a systematic approache plugging in different values in a random search or grid search! Alas, grid search is somewhat a brute force method and requires a powerful computer (multithreading and high core count is king).
Trying out algorithms
I wanted some more information in the beginning to find the best algorithm to do the job. At that point I did not know about the importance of feature engineering yet. The most used algorithms in this challenge are:
- SVM, which bend the data’s hyperspace with a kernel method that sets the classes apart.
- Random Forest, which is a smart play on many decision trees.
- Boosted Trees, which uses a supposedly smart choosing algorithm for decision trees
- Ensemble Methods, such as the Gradient Boosting originally used in the starter notebook. Ensembles use a combination of algorithms and select the best posterior.
- Neural Networks, of adjustable depth neural for different model complexities.
Most Data Science articles talking about “winning Kaggle competitions” will point out that an ensemble method will most likely outperform other methods.
Feature Engineering
Furthermore, it is commonly accepted that the best results are achieved through “Feature Engineering”. A “feature” in the context of ML is something like a column of data. As is, the data is not best conditioned yet for a competitive result. Smart feature engineering can make all the difference and provide large accuracy gains. Machine Learning algorithms are only as good as the data fed to them. The saying that comes to mind is “garbage in, garbage out” or for short GIGO.
Feature Engineering augments the original data and means making the data easier readable for the algorithm, which is supposed to improve model accuracy. This may be achieved by combining multiple features mathematically, or modifying a feature. In the starter notebook, the gamma ray data was smoothed in order to get rid of noise, and multiple new feature columns were created for each sample.
Why would anyone want to participate in a competition after it was completed?
As stated above, it is very useful to practice and hone your skills. It is paramount to go beyond course material and try yourself. While doing so, it is always important to see how other, more experienced people have tackled a certain problem and take the approach into the own repertoire. It is imprtant to build up a portfolio of projects and keeping at it.
I myself have not submitted a notebook in time, having seen the call too late. Nevertheless, only because the prizes and fame are gone, there is no reason not to take the challenge. My current Validaton Set accuracy is not near the top ten on the score board and I believe I have to step up my Feature Engineering game to make some substantial progress Link to Notebook. This entire exercise is iterative and I will keep at it. And you should too.
This brief introductiction should cover some basics to participate in the future geo-ML challenges, grow intellectually, and only perhaps make it amongst the top three. Keep at it!
Thanks to Michael Lis for giving me pointers to the competition and giveing me helpful advice.
Further Reading
Competition Website https://www.xstarter.xyz/
Articles on new Developments in Data Science and Machine Learning https://towardsdatascience.com/
Anaconda Programming Environment https://www.anaconda.com/
Coursera/Stanford University Machine Learning Course by Dr. Andrew Ng https://www.coursera.org/learn/machine-learning